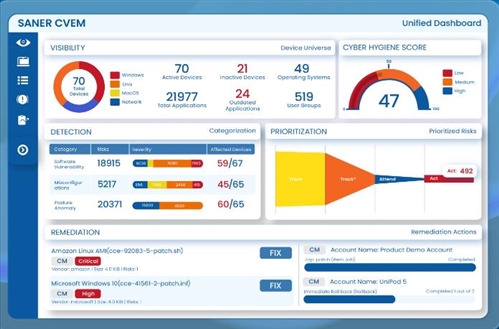
By continuously running a well-built general-purpose database performance monitoring facility, organizations can gain constant visibility into the availability and responsiveness of their databases and database management systems (DBMSs). When such a tool is equipped with analytics to compare historical metrics against current values, administrators can immediately understand how current values and behaviors stack up against prior averages and typical baselines. A well-built database performance monitoring tool also tracks the organization’s databases at all locations for all instances, whether they’re on-premises, in the cloud, or in hybrid implementations running combined on-prem and cloud-based elements. Database performance monitoring tools are particularly helpful when working with open-source databases such as MongoDB, PostgreSQL, Redis, MySQL, and Amazon Aurora. This is because their own built-in consoles and management tools aren’t regarded as user-friendly, powerful, and highly informative. They’re point solutions that work only for their associated platforms. A well-built database performance monitoring tool brings all database instances together under a proverbial single pane of glass, and it makes health checks, analytical tools, alerts, and reports applicable and available for everything under its purview.
Benefits and Challenges of Using Open-Source Databases
More than half of all organizations use an open-source database, and more than three-quarters of new efforts are likely to use one, often in the cloud. But monitoring and performance management are more challenging on open-source databases because they offer less capable and user-friendly consoles and tweaking and tuning tools. Whether commercial or open-source, databases share a common set of key resources—including CPU, memory, and storage—whose provisioning affect performance. Networking is a particular concern in the cloud, though it also applies across the board, since latency can pose performance problems in cloud or hybrid database applications. A database performance monitor is uniquely suited to illuminate and answer database performance questions. It also constantly provides metrics to assess database health. By helping users avoid problems rather than solving them after they manifest, such a tool also helps make databases more reliable and available. Because a good database performance monitor provides improved visibility into database performance as a whole (from the perspective of entire database instances) and on a per-query basis, it also helps speed troubleshooting. Additionally, this same perspective helps drive growth and capacity planning, helps organizations improve their understanding and control over their data, and helps them optimize overall database development and operations.
What to Look for When Optimizing Open-Source Databases
Monitoring is vital in maintaining database and application performance as well as data integrity and controls. But monitoring and performance tuning for open-source databases can be complex and time-consuming. Just as application performance monitoring tools have proven invaluable for DevOps, database performance monitoring provides similar benefits to developers building database queries and applications. In particular, database performance monitoring aids companies in observing query trends, assessing code and query changes, and observing impacts on test and production databases thanks to powerful and focused “before-and-after” analytics tools designed to pinpoint impacts immediately. Although obtaining insight into database queries and applications in open-source databases can be tricky, a good database performance monitoring tool provides only the information developers and DBAs need to understand and tune their way to more optimal and efficient implementations. Through the ability to compare current snapshots against historical data, database performance monitoring tools provide a completely objective, metrics-based foundation for database query and database application tuning. A broad and useful perspective includes metrics for both system and database health, so database performance monitoring encompasses outside-in (operating system-level) and inside-out (DBMS-focused) metrics and values. “Before-and-after” analyses can be used in development and testing stages as well as in production databases, allowing companies to deliver the best possible experience to users working or interacting with their data. Database performance monitoring helps make the impacts of new code or query changes easy to track in real time across the entire organization. All parties get complete visibility into detailed query analysis, which includes real-time and historical views of total elapsed time, latency timings, and counter filtering capabilities. This same data also enables automated alerting so registered parties get notified when a system goes down or when various thresholds for latency, counts, or resource consumption are crossed. Database performance monitoring helps ensure data is always safe, sound, and available to its consumers.
What Sets Database Performance Monitoring Apart From Other Monitoring Tools and Methods?
SolarWinds® Database Performance Monitor (DPM) provides access to customized dashboards designed to let developers, DBAs, and IT staff focus on the most important databases, systems, and queries. SolarWinds Database Performance Monitor even covers GDPR and SOC-2 compliance metrics. Best-of-breed database performance monitoring tools (such as SolarWinds DPM) let interested parties see everything the database does, from query execution and database internals to system resources at the operating system level. Such tools also support all types of open-source databases in a single view across the entire organization, up to thousands of servers. Those charged with database development, optimization, and tuning will find metrics for every query at one-second granularity with the ability to drill down into supporting metrics and values. Time comparisons are available before and after any event, especially code and query changes. Comprehensive database performance monitoring tools also provide database-specific intelligence and recommendations, as they point out opportunities for optimization where companies can make the biggest gains. Troubleshooting is another area where good database performance monitoring tools excel. They help DBAs in numerous ways, including the following:
- Isolating unusual behavior, identifying potential contributing factors, and validating changes
- Correlating query behavior with system metrics to understand bottlenecks; query optimization, adding resources, and precision tuning serve to minimize unintended or unwanted outcomes
- Researching and observing improvements to queries
- Exploring query details and performance, including samples and execution plans
Overall, SolarWinds Database Performance Monitor heralds a new era of database performance management, where detailed observation drives tuning and changes toward better outcomes.
Next Steps
Visit the SolarWinds Database Performance Monitor homepage or watch the Get Complete Visibility for Faster Application Troubleshooting webinar video.


.png)


.png)
-min.jpg)


.jpg)

mVXK.jpg)
.jpg)
.jpg)
.png)
.jpg)


.jpg)

.png)

.png)

.jpg)
.jpg)

.png)
.png)


.png)


.png)
.jpg)


.jpg)


